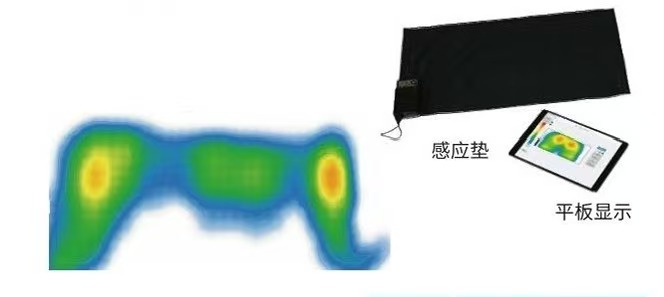
Visualize invisible pressure, converting it into referenceable numerical values and graphs.
This data can be used for analysis and comparison in research and clinical settings.
For example, in the prevention and treatment of bedsores, changes in pressure values can be used to determine appropriate solutions and select the right bedsore prevention product.
When our patients are often unable to clearly describe their effects and feelings, doctors or therapists can provide a more scientific and convincing basis for their assessment.